Deployment#
In real_world example, you can see the configuration settings for the monitoring infrastructure:
Grafana for visualization
Tempo for storing traces
Loki for storing logs
Prometheus for storing and exporting metrics
Vector for collecting logs from containers
Docker for containerization and quick launch
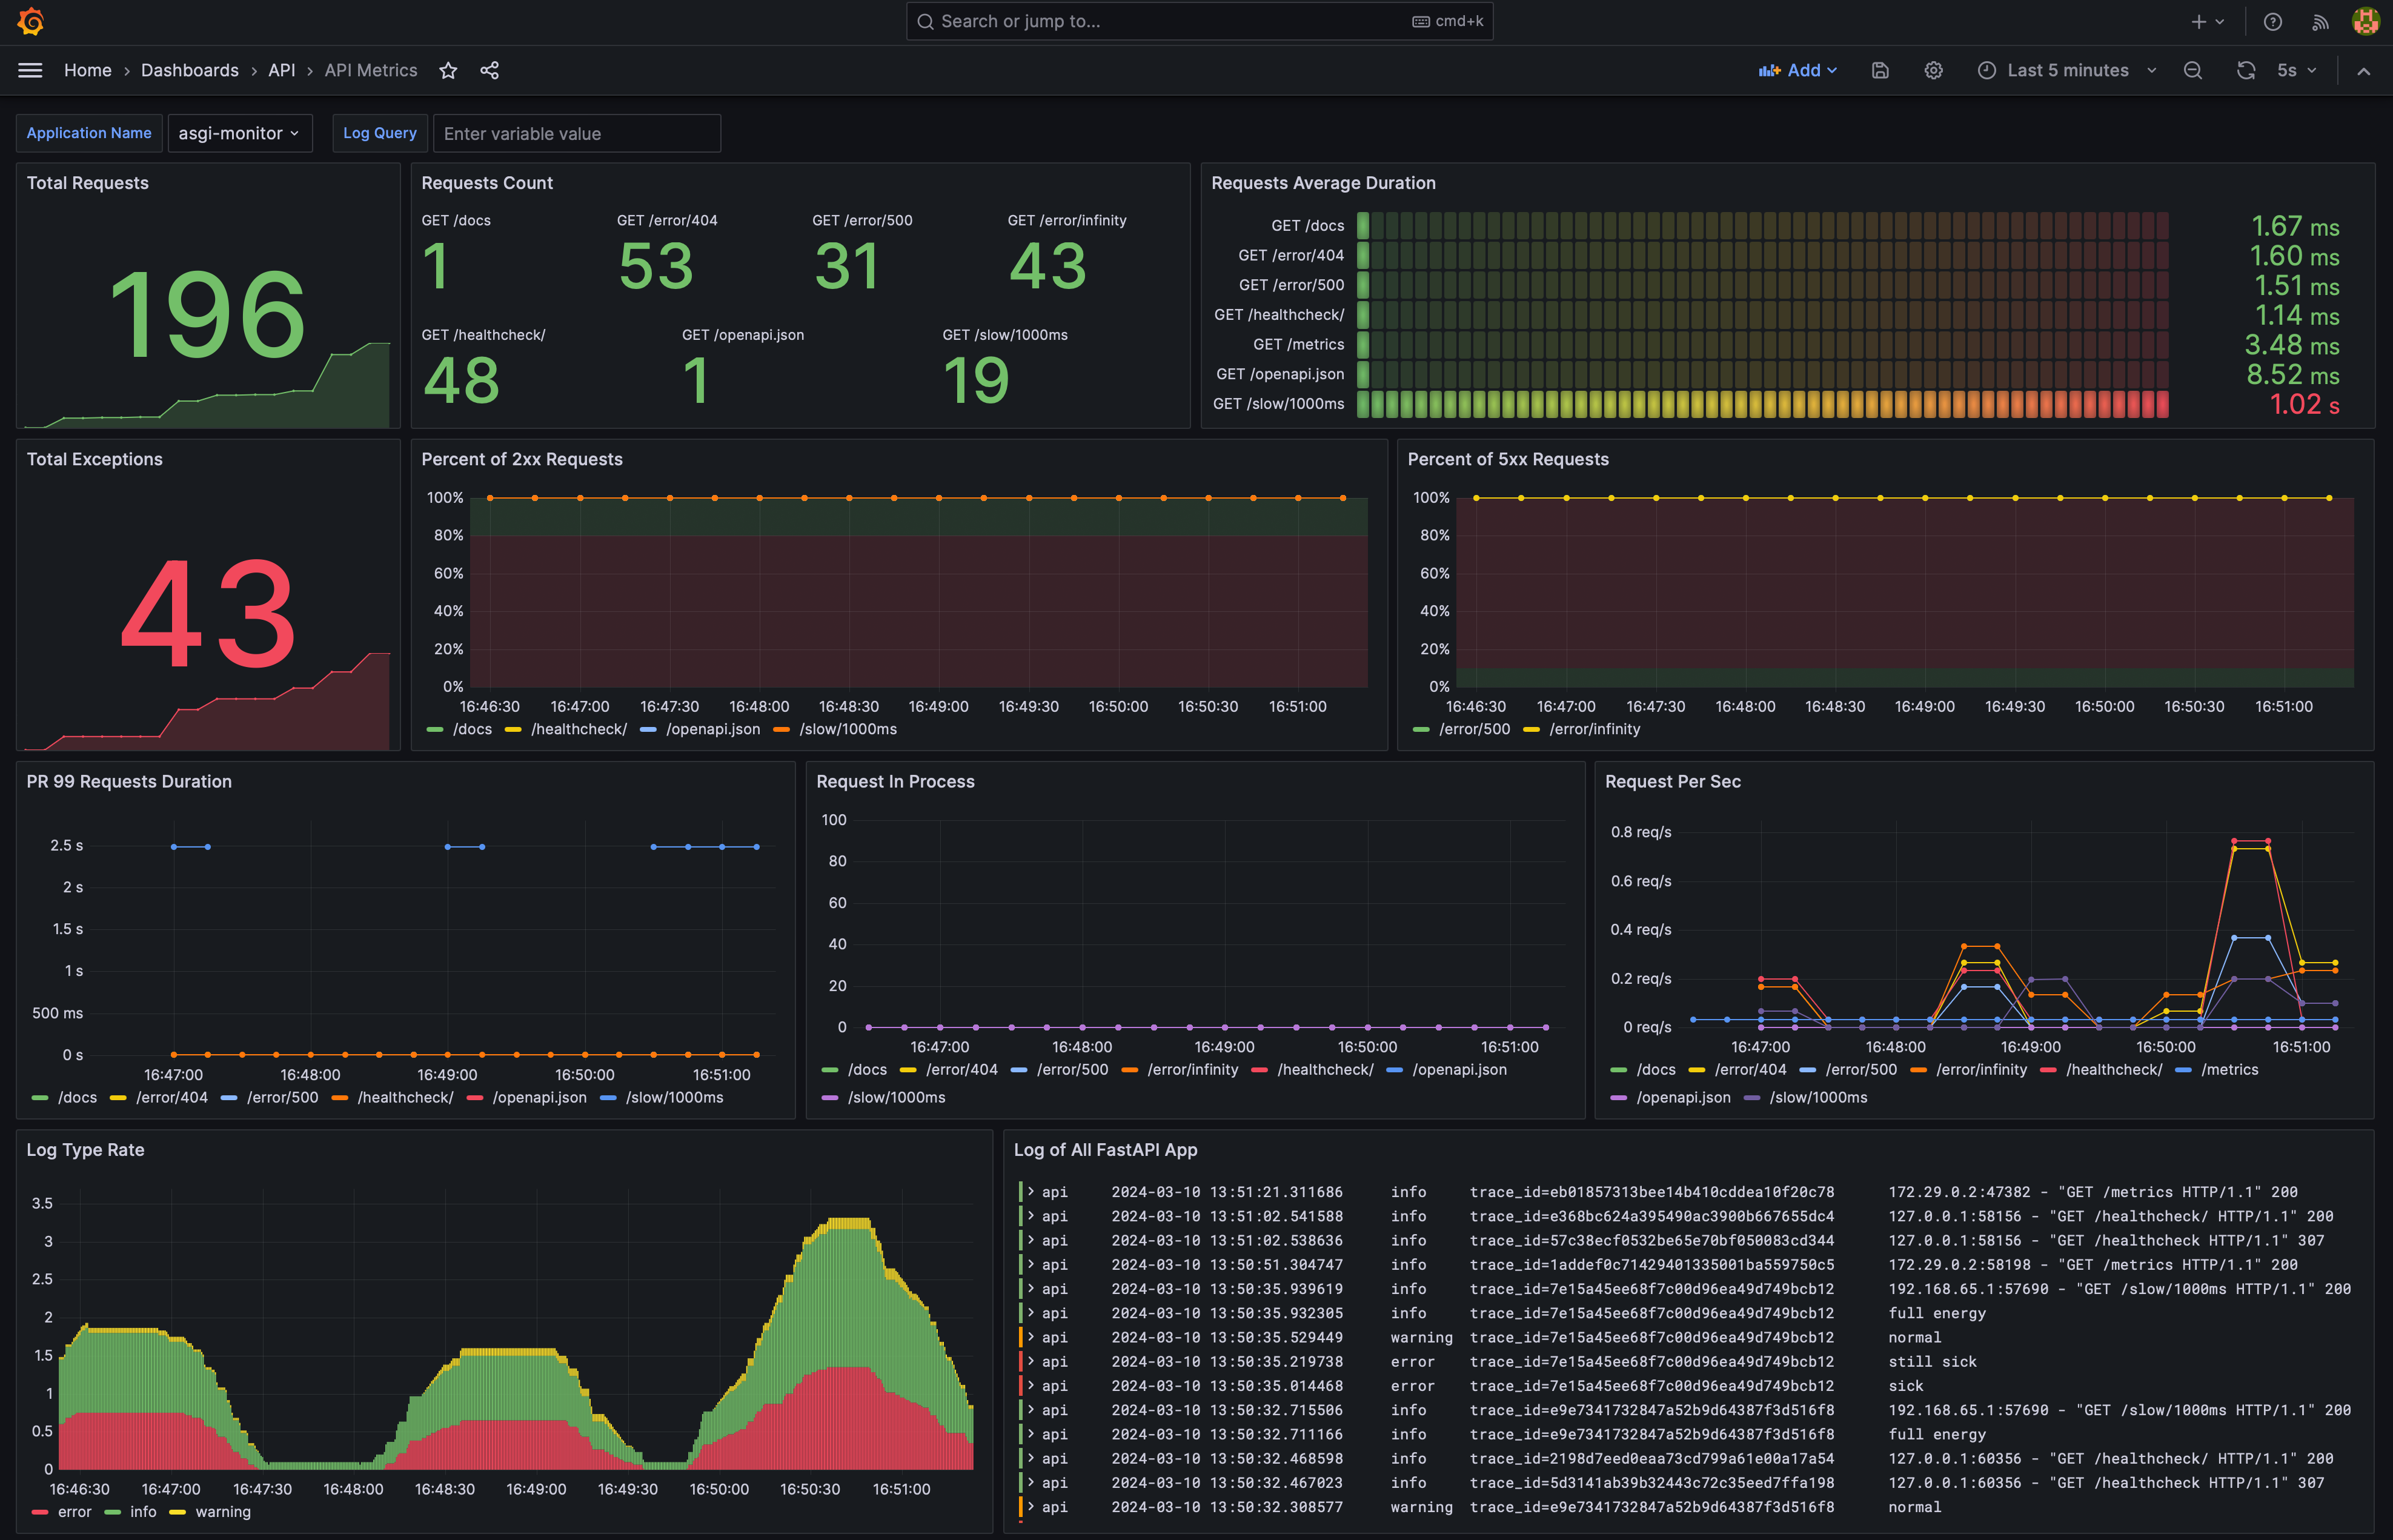
At the output, we have a real-time dashboard monitoring
Warning
Use these configs as a basis, but you need to take care of setting up authorization and long-term storage of information!